Citation with persistent identifier: Harris Cline, Diane and Eleni Hasaki. “The Connected World of Potters in Ancient Athens: Collaborations, Connoisseurship, and Social Network Analysis.” CHS Research Bulletin 7 (2019). http://nrs.harvard.edu/urn-3:hlnc.essay:ClineD_and_HasakiE.The_Connected_World_of_Potters.2019
Abstract
The Social Networks of Athenian Potters project uses social network analysis to map relationships between the black-figure vase painters of the Athenian Kerameikos to obtain a panoramic view of how artists in an industrial quarter connected. For this experiment we chose Beazley’s Attic Black-figure Vase-Painters as our source of data. We recorded the hundreds of connections between individual artists, groups, and the shapes they made in common. This is the first study to visualize, calculate, and evaluate these associations and interconnections. Our research links connoisseurship studies with quantitative analysis to explore the organization of ceramic production in Archaic Athens.
Report
The Social Networks of Athenian Potters
Sir John Davidson Beazley identified more than 1,000 potters and painters for over 20,000 black-figured and red-figured vases. Beazley shared the results of his research in his 850 page book, Attic Black-figure Vase-Painters (ABV; Beazley 1956), and the three-volume set, Attic Red-figure Vase-Painters (ARV; Beazley 1963). His groundbreaking work in attribution has shaped the study of ceramic production in ancient Athens and beyond (Osborne 2018: 26–50). Our project, entitled Social Networks of Athenian Potters, is the first one to use the ABV as our data for constructing a social network analysis of the community of potters and painters in Athens. Athenian vase-painters developed new techniques, styles, iconography and themes, some of which spread fairly rapidly through the Potters’ Quarter of Athens. We hoped that data visualizations of ABV might help us identify these pathways and key players for innovation.
Living in a time without computers and programs, Beazley may be seen as a researcher investigating clusters of artists and the ties between them, similar to those we study using social network analysis (SNA). The questions he asked and the answers he sought addressed the nature of the social relationships: who was central, who was peripheral, who influenced whom, how did ideas move across time and space through relationships, how did new technologies and stylistic advances spread through the communities? These are key questions in our study as well.
Visualizing Potters’ Communities
Beazley’s assemblage of vase-painters seemed to us to be an excellent candidate for applying SNA for two main reasons: we saw in his loosely defined terminology a rich social vocabulary (follower of, imitator of, “brother”, etc.; Robertson 1983), and also because all these relationships painstakingly recorded by Beazley could not be easily seen by reading hundreds of pages in its linear form. Scholars of vase-painting connoisseurship tend to specialize in one painter (e.g. Exekias; Mackay 2010), a potter (Nikosthenes; Tosto 1999) or a group of potters (Little Master Cups; Heesen 2011) , but even in the group analysis, artists are presented in a linear way. A chronological chart by Boardman (1974) included ca. 45 artists who were active from 625-400 BCE but did not convey any of the stylistic relationships as outlined by Beazley. Even the Beazley Archive Pottery Database, an otherwise indispensable tool for research on vase-painting, is more object-oriented and allows searches for individual artists and their vases but at the moment does not allow searches for connections among artists.
A notable attempt to actually visualize the types of collaborations among vase-painters did attract our attention: Osborne produced a wire diagram in 2004, to illustrate three modes of collaborations between red-figure potters and painters: a) one potter with one painter; b) one potter with several painters; and c) many potters and many painters (Figure 1). For our initial experiment of the viability of SNA for Beazley’s work, we converted his wire diagram into a sociogram, featuring the relationships between early red-figure vase-painters. The imprecise use of lines in the wire diagram makes for some difficulty interpreting the relationships.
For an example where two artists collaborated, let’s look at the Syriskos Painter and Syriskos Potter in the middle of Figure 1. The horizontal line seems to skim the top of these words, whereas in other cases the line is dead center (e.g., the Phintias Potter and Painter near the top of the left column). It seems that potters populated the right and left columns with painters down the middle, but it is unclear to the reader on what basis the potters were placed right or left of center and if that placement has significance. For example, why is the Epiktetos Potter is on the right side when there is room for him on the left? Our eyes are drawn to the busiest parts of the diagram: Psiax, the Kachrylion Potter, the Andokides Potter, the Brygos Potter, and Oltos. Epiktetos is important but has the misfortune of being tied to painters in his same column, hence the vertical lines downward but which swoop around on the curves to end up where they started. Curved lines and angular straight lines are both employed, with the viewer wondering if they signify the same thing or if there is a difference. Wire diagrams do give a good overall impression of connectedness but are not great for understanding the particulars. We translated the same data set from the wire diagram into a social network sociogram to study the same set of potters’ collaborations (Figures 2 and 3).
As in Osborne’s wire diagram (Figure 1), there are 88 named artists with 74 ties between them; six unnamed artists from Osborne’s graph were excluded. The artists are not all connected, however. Different colors were used to differentiate these disconnected components by numbers of artists working together (Figure 2). The majority are pairs who only worked with each other, so far as we know, rendered in black. The three little groups with three nodes each are all the same color, purple. The largest group is dark blue, and a medium one beneath it is in light blue. Of the 19 separate components, these larger groups stand out immediately and are worth investigating further.
Now that the data has been transformed into a sociogram, some analysis can be done. The largest cluster (around Oltos and Epiktetos) consists of 39 craftsmen who are all linked together in one component, running through the middle of the graph in dark blue. Since these 39 craftsmen are interlocking, we must conclude that they are roughly contemporaries, or at least within the same generation. The chain below it (around Douris) has nine interconnected craftsmen represented in light blue.
The use of color in charts can help with pattern-finding, leading to new insights and interpretations. While the color scheme in Figure 2 has worked for identifying quickly the separate interlocked components of artists, another color-coding scheme helps quickly identify which are potters and which are painters. In the second variation of this sociogram (Figure 3) the colors indicate whether the craftsman was a potter (red) or a painter (blue). This alternative color scheme draws the eye to those cases where one potter works with multiple painters or vice versa. If one is interested in how craftsmen collaborated, this layout is especially informative. For instances where one potter worked with multiple painters, three cases easily stand out: the Kachrylion Potter and his collaboration with four different painters (Oltos, Hermaios Painter, Painter of Louvre G36, and Thalia Painter); the Brygos Potter and his four collaborator painters, and finally the Andokides Potter with four painters working with him. Moving to painter-centered collaborations, we find the painter Douris working with four different potters. In the upper left, the isolated component of four people includes three painters and the Hieron Potter who worked with them all. Using color to differentiate potters from painters offers a significant advantage over a wire diagram.
Social Network Analysis of the Athenian Black-Figure Vase-Painters
The sociograms help us see the relationships from the network perspective, synoptically, allowing us to study unique artists in their contexts. With all artists, groups, and shapes in one chart, patterns can be observed which initiate a series of inquiries. We used this sociogram of red-figure vase-painters as a proof of concept that convinced us to undertake the study of Attic black-figure vase-painters active in Athens between 650-400 BCE.
In a book as sweeping in scope as Beazley’s ABV, it can be difficult to keep all of the connections between the potters and painters in mind at once. Our project is the first one to actually visualize, calculate, and evaluate these associations and interconnections, moving beyond lists of painters and potters in linear form or databases which keep interrelationships hidden. By combing through over 1000 pages of ABV and Paralipomena combined we recorded the connections between individual artists, groups, and the shapes they made in common. We entered the data on a spreadsheet, and when we finished, we formatted the data for the social network analysis program, NodeXL.
The sociogram above (Figure 4) is an earlier experiment we did with a subset of the ABV, and shows that the pattern we observed from Osborne’s red-figure subset, namely that potters and painters were not exclusive but collaborated with several partners, was also the practice earlier in the 6th c. BCE.
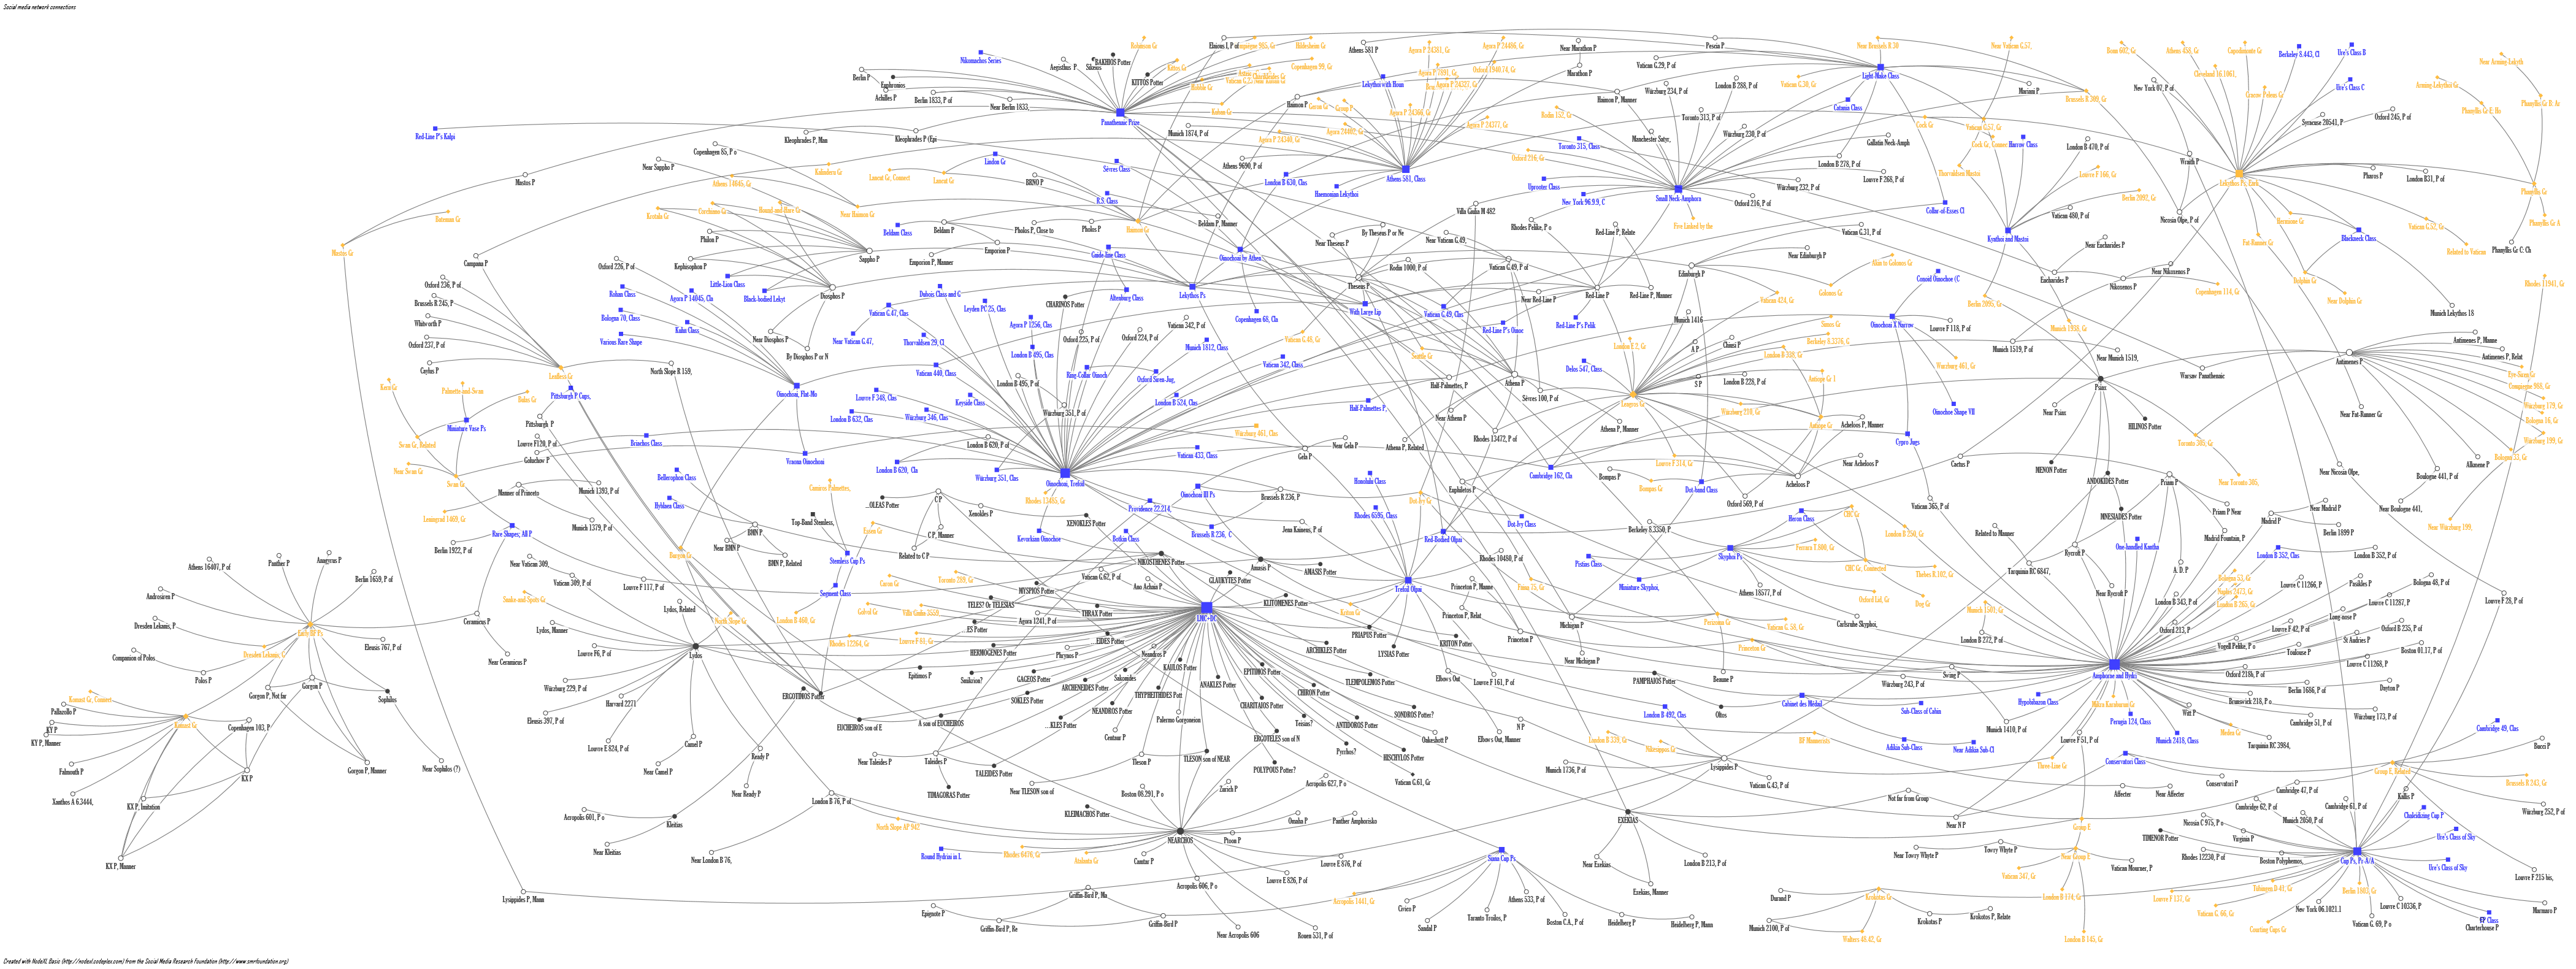
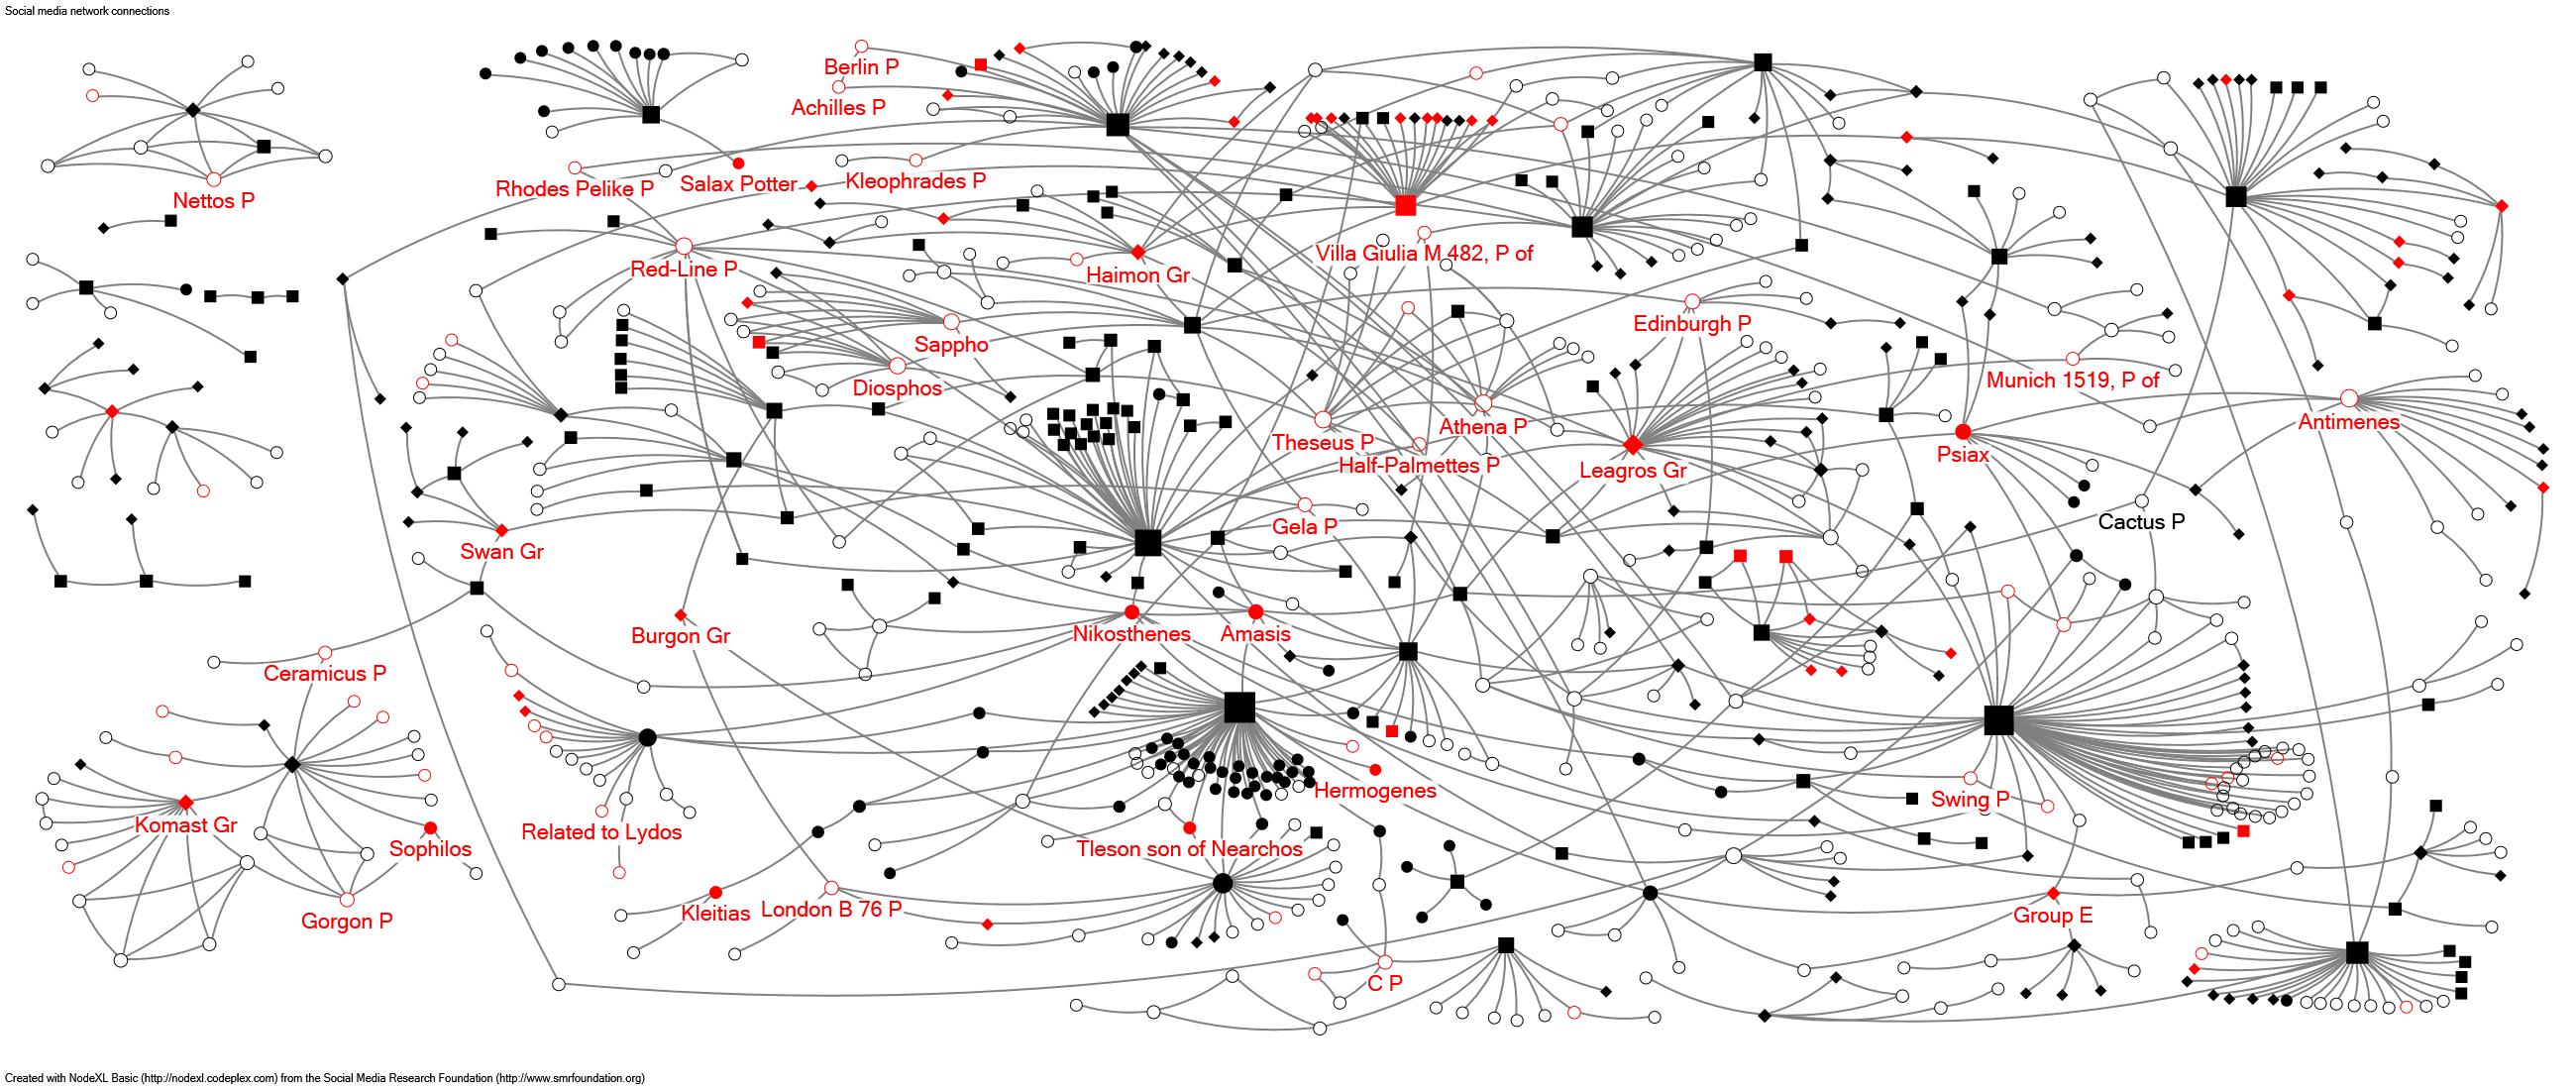
As we scaled up, converting the entirety of ABV and Paralipomena into a sociogram, we looked for the ties between people working in the Potters’ Quarter. We found three main entity types: individuals like Nikosthenes; groups of artists given one title such the Tyrrhenian Group; and vase shapes such as Little Master Cups and subsidiary shapes within the major ones which Beazley called ‘classes’. We identified 710 nodes in ABV consisting of artists, groups, classes, and shapes with 863 edges. We counted 82 black-figure potters and painters whose real names are known because of their signatures, and 326 artists given names through connoisseurship. There are 127 vase shapes and classes, and 169 artist “groups” (Figure 5). We visually differentiated these types of nodes in our graphs (Figure 6). Including both people and shapes in one network is called a bi-modal or affiliation network, and poses more challenges in analysis.
SNA is used in many other fields, and increasingly in the field of classical archaeology, to look for and trace connections and pathways for the diffusion of innovations (Mills 2017). We were able to render the sociograms in different layouts to show the structure of the network, the ties between artists and the shapes, who was central and who was peripheral, and search for the paths through the network connecting various well-known vase-painters over time. Because Beazley’s prose in ABV includes no illustrations or figures, our sociograms help us see connections between artists who are many pages apart. We believe that the numbers of known artisans (roughly 1000 for both black and red-figure, including signed artists, attributed artists, group and class names) and the different ways they collaborated is best rendered through digital data visualizations. Social network analysis and connoisseurship share a strong visual component: in a visually-oriented field such as connoisseurship, it should not come as a surprise that some things are better explained visually.
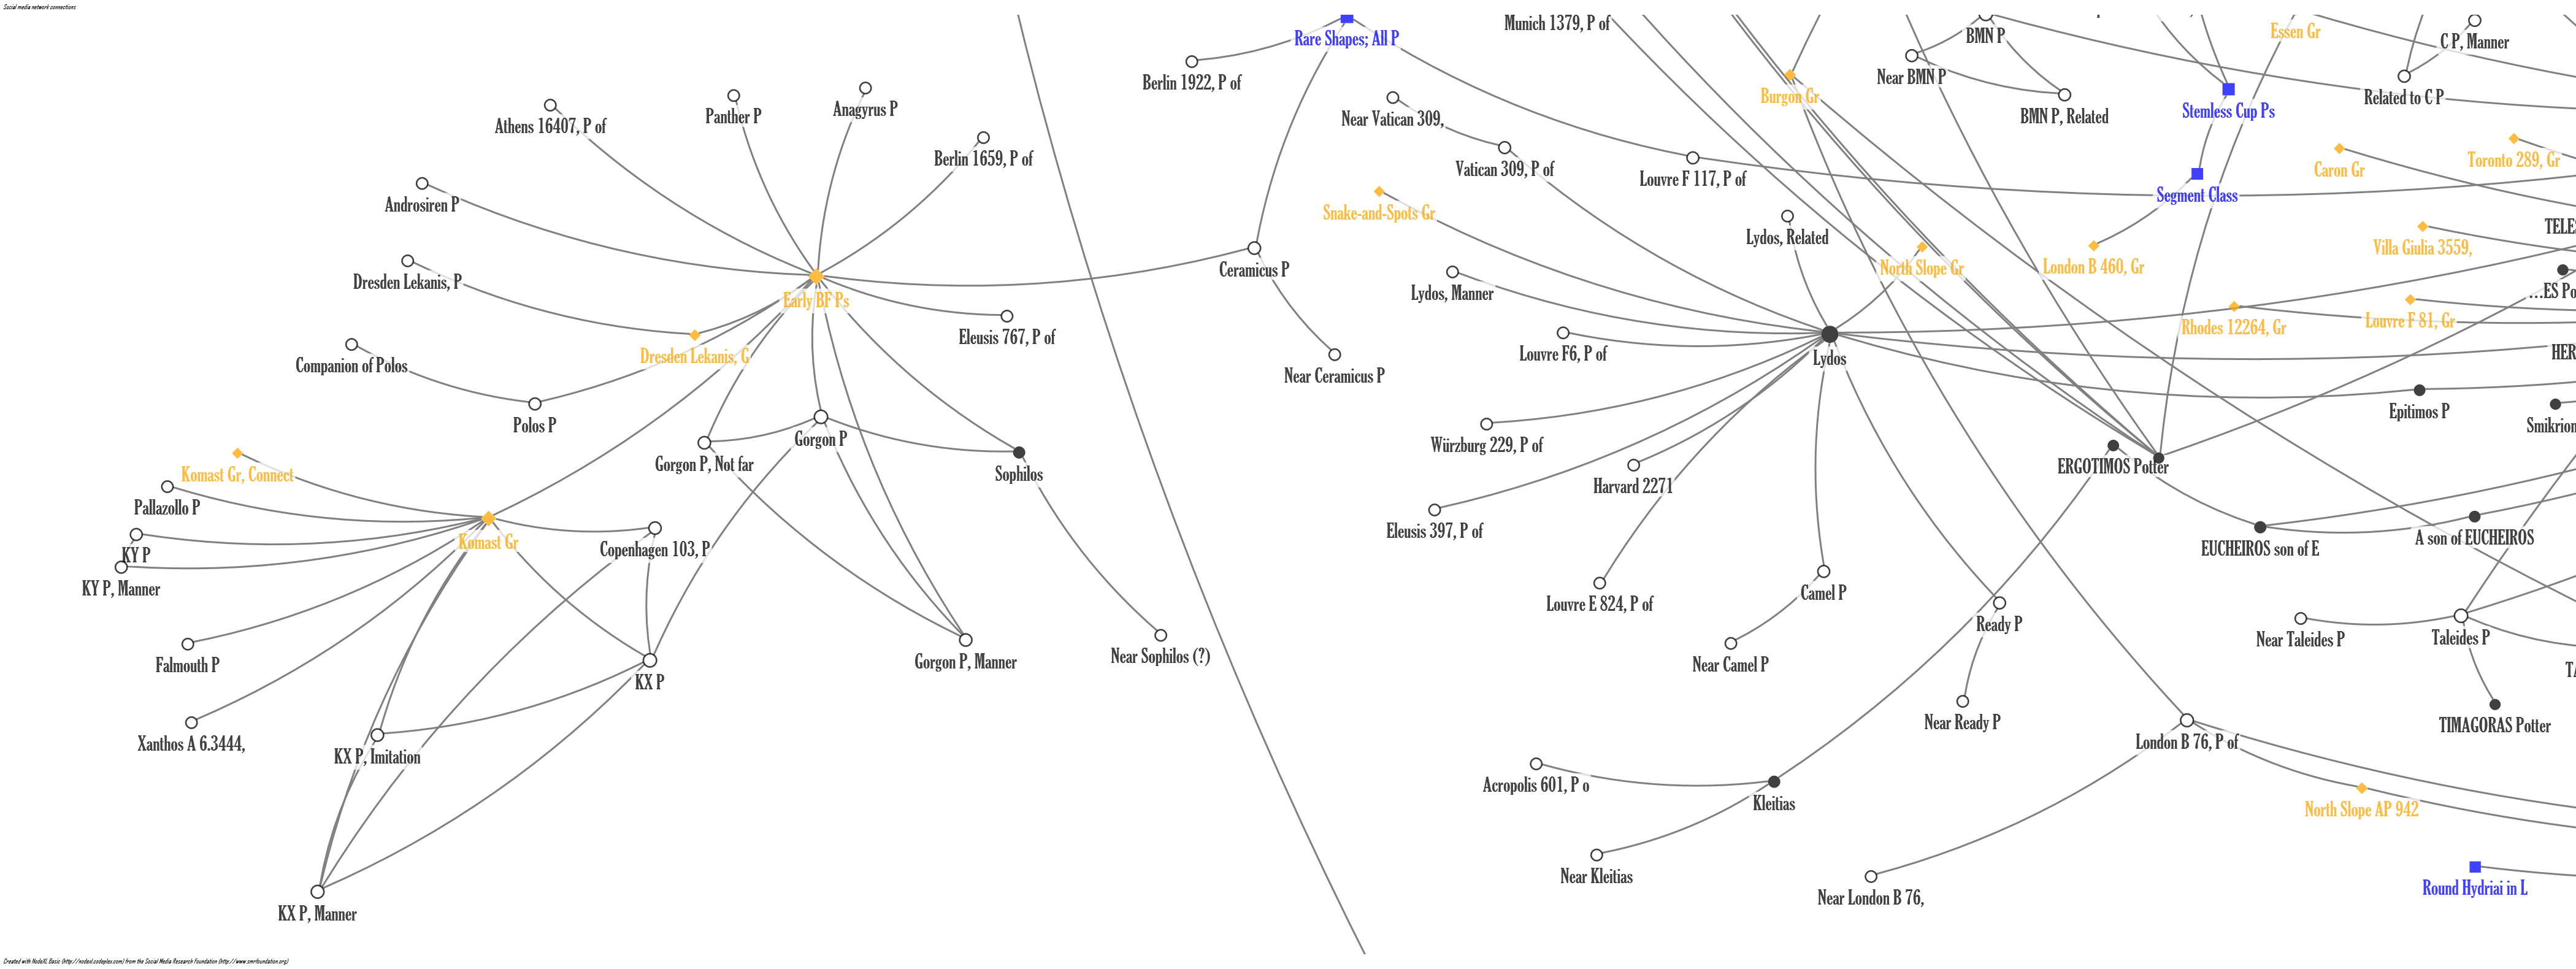
In order to make better sense of this network of intricately connected potters, painters, and vase shapes (Figure 6), in our next steps we will need to subdivide the data into segments by date. The earliest black-figure artists should not be in the same social network as those who painted in both black and red-figure, as they are 125 years apart (Figure 7). Dividing the chart by quarter centuries, making what are called “time slices”, will allow us to analyze each “time slice” alone and then compare it to its chronological neighbors in order to study continuities and changes over time. SNA provides two ways to see patterns and make discoveries: through the data visualizations called sociograms, and through the statistical measures given to each node in the network (e.g., degree centrality, betweenness centrality, eigenvector centrality, etc.). This technical part of the project is being published elsewhere (Hasaki and Cline in press).
While we probe deeper into the ABV sociogram, we have also begun to convert Beazley’s work on Athenian red-figure vase-painters (ARV) to prepare it for social network analysis. The years 530-500 BCE was an intense period of creativity where Athenian artists experimented with several decoration techniques (e.g., Six’s technique, coral-red gloss, white ground, and added clay and gilding), but it was the innovation and diffusion of the red-figure technique of the Athenian vase-painters that took hold, while others faded away within a generation (Cohen 2006). The comparison of sociograms between Athenian vase-painters working in the black-figure technique, originally a Corinthian import, and those working in the red-figure technique, an Athenian innovation, will show how the new technique affected the collaboration between artists and the diffusion of style. Our early experiments with red-figure artist networks suggest that there will be many more direct ties between potters and painters after c. 520 BCE.
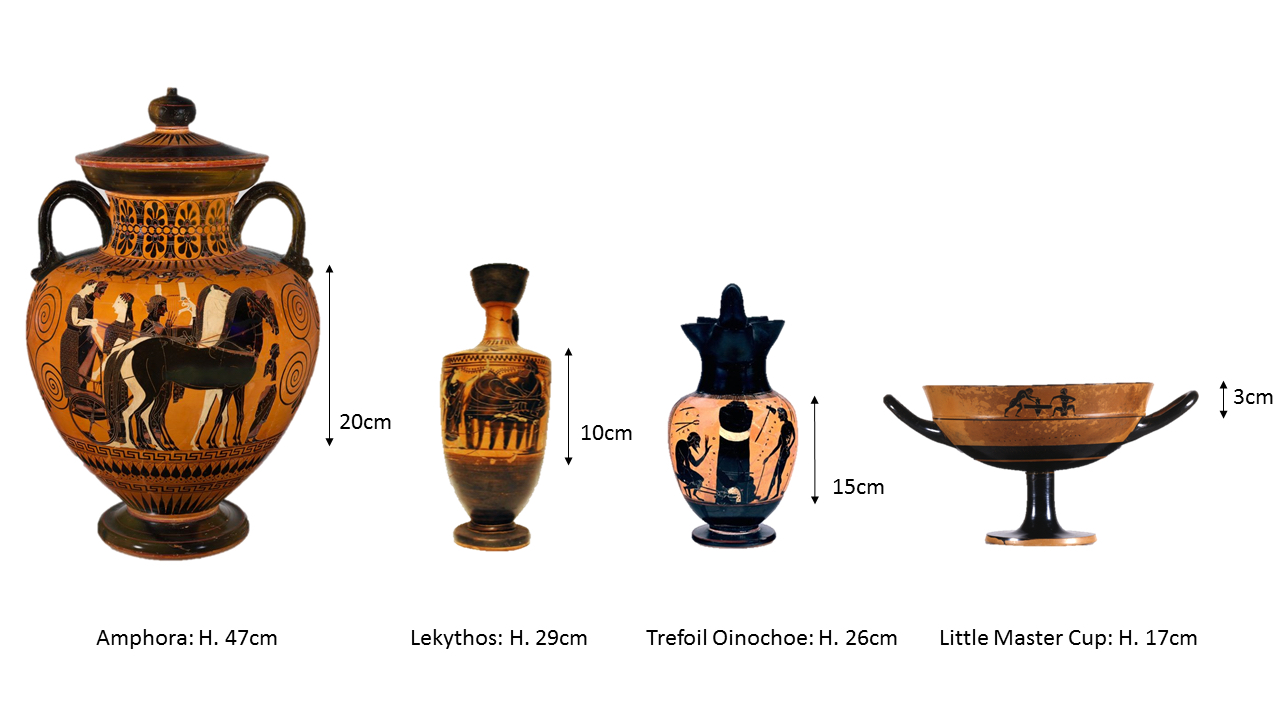
The Importance of Shapes and Trade Networks
In the course of our project, we focused on the importance of shapes in clusters of craftsmen, and see how shape-specialization creates communities both for potters and for painters. We included vase shapes as nodes in the network because they unite communities of artists. There are good reasons to include vase shapes when searching for social communities: It takes different skills to pot and paint small cups and medium or large vessels. The curvature and scale makes a difference (Figure 8). In the case of the kylix, one painter might specialize in just exteriors and others just in the tondos. Those who only do tondos might be likely to know each other in the Potters’ Quarter, see each other’s work and get fresh ideas, and likewise all the other specialists.
During our CHS collaborative fellowship (Fall 2018) we organized a panel entitled “Decorating Ancient Greek Vases: The Shapes and Scenes” with vase-painter Thanassis Katsaras to help us better appreciate the syntax of decoration on ancient Greek vases. Katsaras, working at his Amasis Workshop in Eleusis, is highly regarded as one of the best living ceramicists for reproducing ancient Greek vases. His live hands-on demonstrations were illuminating for the complex decision making processes that our community of ancient Greek potters would have had to make. The shape of the vessel proved to be crucial with regard to the choices vase-painters considered when framing a scene. The vase shape placed constraints on selecting an appropriate theme for certain surface zones (triangular vs. rectangular). Finally, the filling ornaments turned out to be important for rendering a well-balanced composition.
All this shape-specific technical knowledge was transmitted from generation to generation in the potters’ quarters, where potters and painters learned how to adhere to a strong tradition in shape specialization. Scales of potting and painting were, therefore, intrinsically linked. Through our social network analysis, the impact of shapes on the organization of the Athenian Potters’ Quarter becomes very clear.
Beazley’s connoisseurship efforts focused on Athenian vases mostly in major European museums recovered from Italian tombs and therefore he was dealing primarily with Athenian exports. This suggests we are dealing with a subset of all Athenian artists, namely those who were able to get their wares into the export trade network. Would the relationships among artists have been different if Beazley dealt mostly with locally-used vases? As a first test, we used the Athenian black-figured artists whose works were discovered in the course of excavating the Athenian Agora (Agora XXIII). The Agora artists, highlighted in red, are relatively few, and some absences stand out immediately (Figure 9) — the otherwise very visible class of Little Master Cup artists is barely represented, perhaps because symposium wares have little use in a site of commercial and civic activities such as the Athenian Agora. Comparing this constellation of artists to Athenian artists represented at sites in Magna Graecia or Etruria may help us understand trade patterns and the export market.
Broader Impact
The Social Network of Athenian Potters project is the first time Beazley’s magnum opus has been visualized in a synoptic, comprehensive way, allowing scholars to see both specific artists but also their wider contexts (Figure 10).
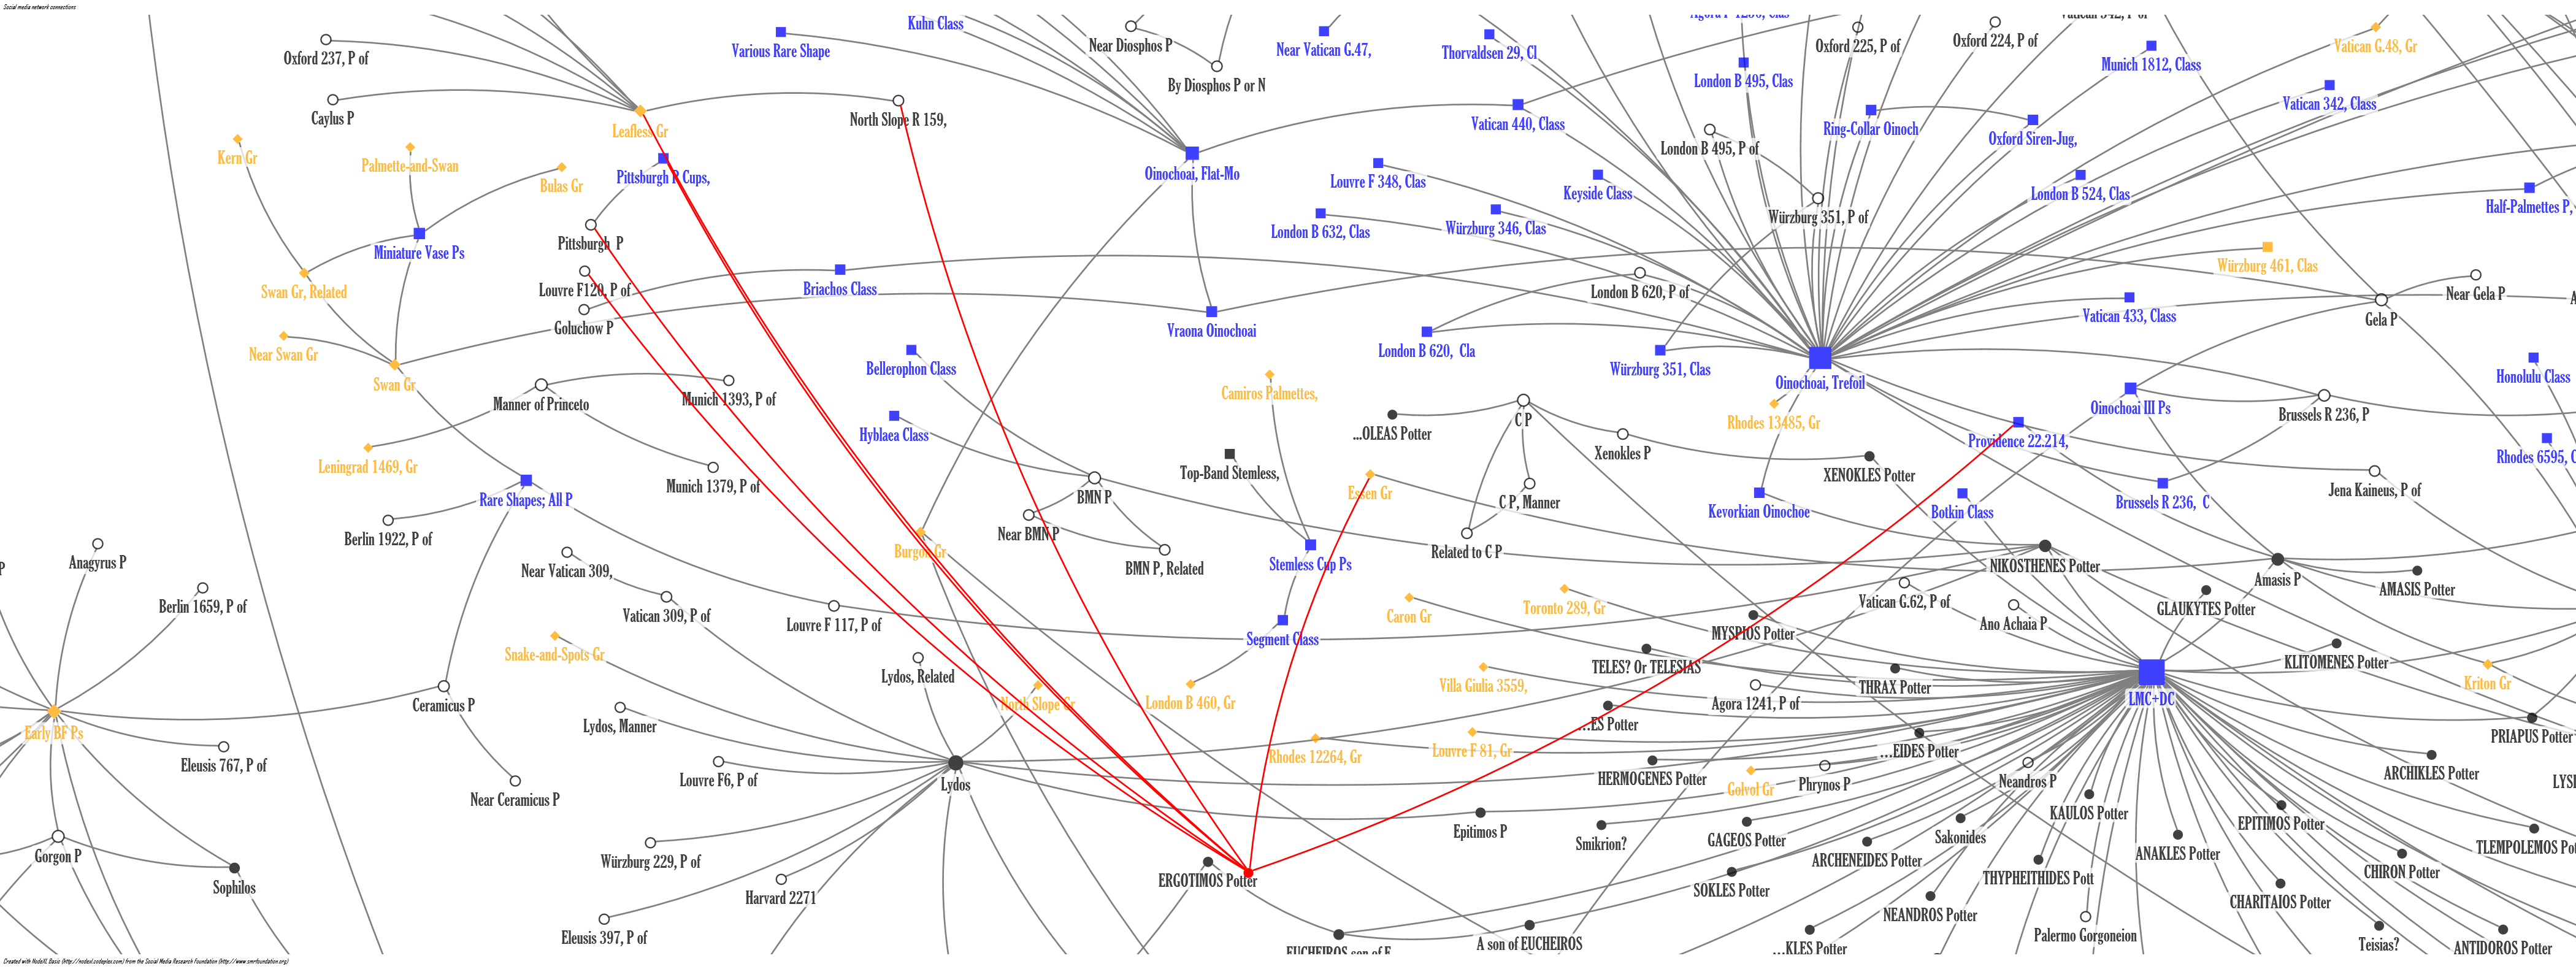
We are reframing the traditional art-historical paradigm which tends to focus on the cult of genius of well-known artists with their top-down transmission of execution, design, iconography, and style. We use social network analysis to search for the artists whose ideas were carried along pathways laterally inside a community through interaction. Through SNA metrics we can identify the important people, who tend to be connected to more than one shape, acting as bridges and innovators. We are also able to showcase lesser known artists for their contribution to the diffusion of new ideas because of their position in the network. Our social network visualizations reveal artists who act as facilitators, bridges, and innovators based on their positions in the network and the shapes and classes which connect them (Figure 11). We are interested in tracing the flow of the diffusion of innovations and exploring the paths through the networks for influential artists to gain attention and followers. Some researchers of social networks use the term contagion to discuss the transmission of ideas, practices, or objects through friendships, and how these very interactions strengthen or transform the network (Borgatti and Foster 2003:1005).
In using social network analysis to study clusters of artists and the structure of their network environment, we strive to shift the discussion from the restrictive model that one person at one moment introduces changes in shapes or techniques, to thinking about the development of Attic vase-painting as a process whereby potters with agency and interaction shared ideas and transferred knowledge through social interaction, constrained by the structure of their social network. This approach challenges earlier, somewhat monolithic, statements, such as “It is easy enough to assume that the red-figure technique must have been invented by one man at one moment, for it required the deliberate decision to reverse the normal color scheme of black figured on a red ground” (Williams 1991:103).
Our Social Networks of Athenian Potters project joins a growing body of innovative research projects employing SNA analysis. We anticipate that our work on the data set of Athenian vase-painters will contribute to promoting the digital humanities in the field of Greek vase-painting. By studying the interconnectedness of the Athenian potters we hope that researchers will combine the traditional scholarly focus on the single vase and its producer with a more holistic approach of the Athenian Potters’ Quarters.
Bibliography
Beazley, J. D. 1956. Attic Black-Figure Vase-Painters. Oxford.
———. 1963. Attic Red-Figure Vase-Painters, 2nd edition. Oxford.
———. 1971. Paralipomena: Additions to Attic Black-Figure Vase-Painters and to Attic Red-Figure Vase-Painters. Oxford.
Boardman, J. 1974. Athenian Black Figure Vases: A Handbook. London.
Borgatti, S, and P. Foster. 2003. “The Network Paradigm in Organizational Research: A Review and Typology.” Journal of Management 29.6:991–1013.
Cohen, B. 2006. The Colors of Clay: Special Techniques in Athenian Vases. Los Angeles.
Hasaki, E, and D. Harris Cline. 2018. “Beazley’s Connoisseurship and Athenian Kerameikoi: A Social Network Analysis.” In Reconstructing Scales of Production in the Ancient Greek World: Producers, Processes, Products, People; Proceedings of the XIX Conference of Classical Archaeology, Archaeology and Economy in the Ancient World, Bonn 22-26 May 2018, ed. E. Hasaki and M. Bentz. Heidelberg in press.
Heesen, P. 2011. Athenian Little-Master Cups. Amsterdam.
Mackay, E. A. 2010. Tradition and Originality: A Study of Exekias. Oxford.
Mills, B. J. 2017. “Social Network Analysis in Archaeology.” Annual Review of Anthropology 17:379–397.
Moore, M. M., and M. Z. Pease Philippides. 1986. The Athenian Agora XXIII: Attic Black-Figured Pottery. Princeton.
Osborne, R. 2004. “Workshops and the Iconography and Distribution of Athenian Red-figure Pottery: A Case Study.” In Greek Art in View: Essays in Honour of Brian Sparkes, ed. S. Keay and S. Moser, 78–94. Oxford.
Osborne, R. 2018. The Transformation of Athens: Painted Pottery and the Creation of Classical Greece. Princeton.
Robertson, M. 1982. “Beazley’s Use of Terms.” In Beazley Addenda Additional References to ABV, ARV, and Paralipomena, ed. L. Burn and R. Glynn, xi–xviii. Oxford.
Tosto, V. 1999. The Black-Figure Pottery Signed Nikosthenes Epoiesen. Amsterdam.
Williams, D., and L. Burn. 1991. “Vase-painting in Fifth-century Athens.” In Looking at Greek Vases, ed. T. Rasmussen and N. Spivey, 103–130. Cambridge.